Block description
• This block monitors the sensors on the board for a specified duration starting when the project is uploaded to the board. A project can contain only 1 Monitor block.
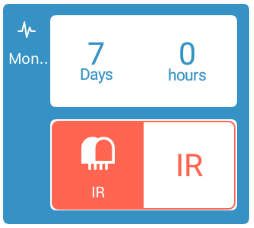
The sensors to be monitored have to be dragged into the head of the Monitor block.
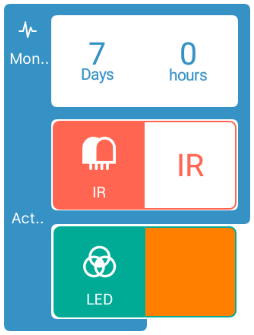
• You can use the Action section of the block to run other code on the board while the sensors are being monitored in the background.
- The data collected from the sensor(s) is displayed in the form of a graph in the Dashboard section of GraspIO Studio.
App interface and usage
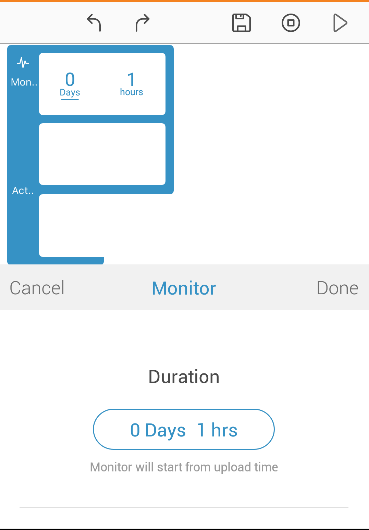
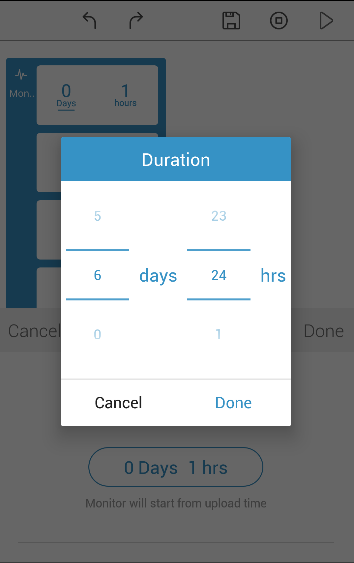
Duration
Here, you can set the duration for which the project should run on the board. The project starts to run from the time of upload.
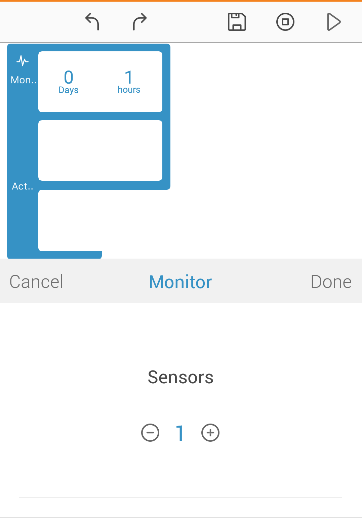
Number of sensors
Here, you can set the number of sensors to be monitored. Currently, a maximum of 3 sensors are supported.
The Monitor section of the block expands as shown below.
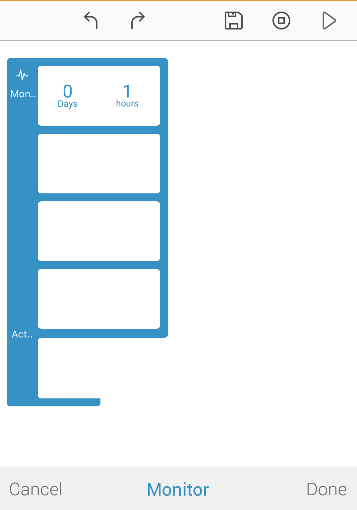
Action section
Here, you can set Action to On, if you want to run other code besides just monitoring and data collection of sensor values.
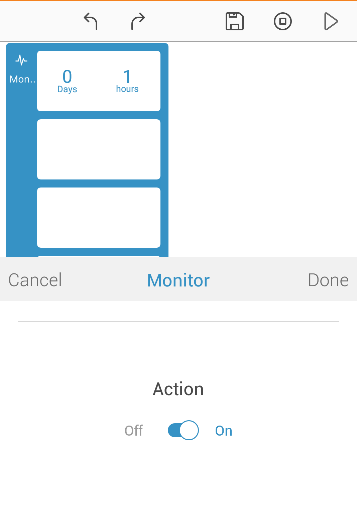
This part contains block(s) that run (in parallel) along with the sensor monitoring.
After the Monitor block parameters are set, you can drag the sensor blocks from the Input category below into the Monitor block.
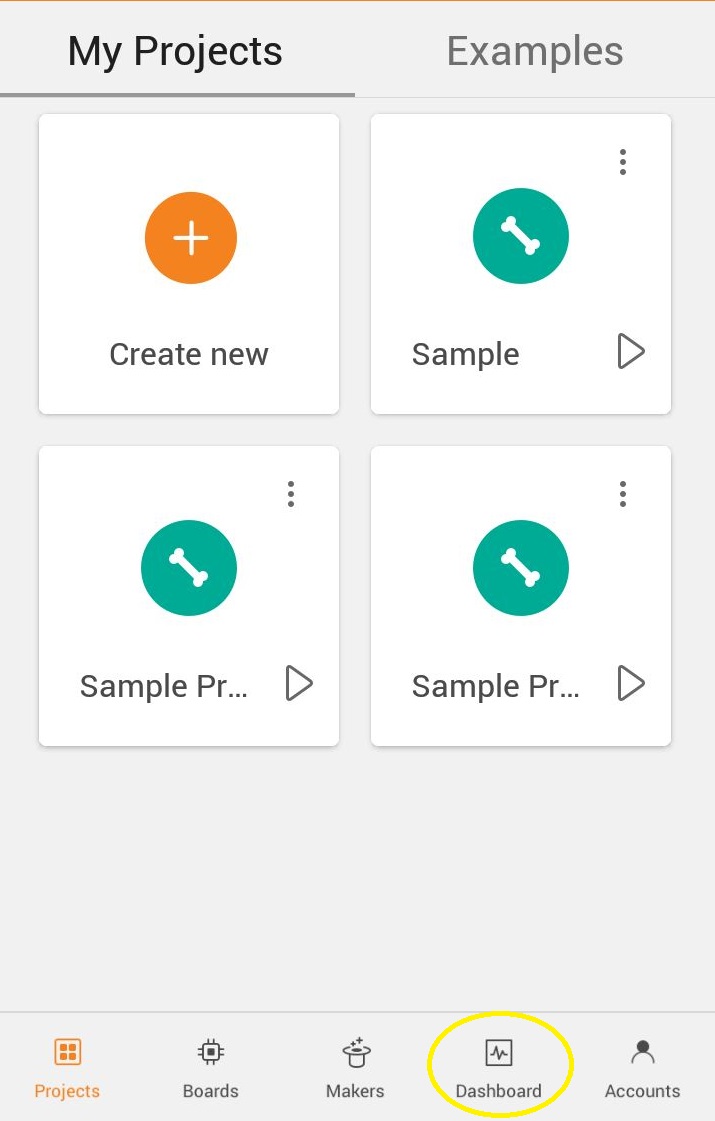
Dashboard
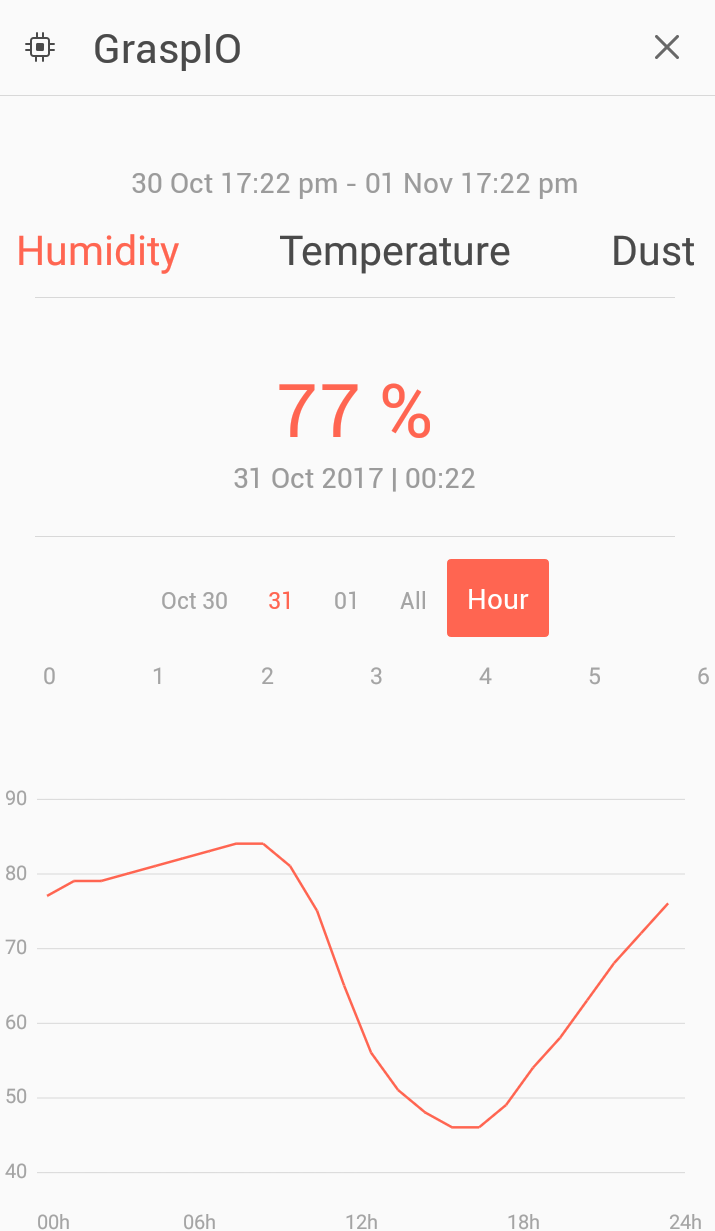
The data collected from the board is displayed in the form of a graph in the dashboard section of the app.
This section displays a list of boards that are currently running Monitor projects, or have run Monitor projects that haven't been overwritten yet.
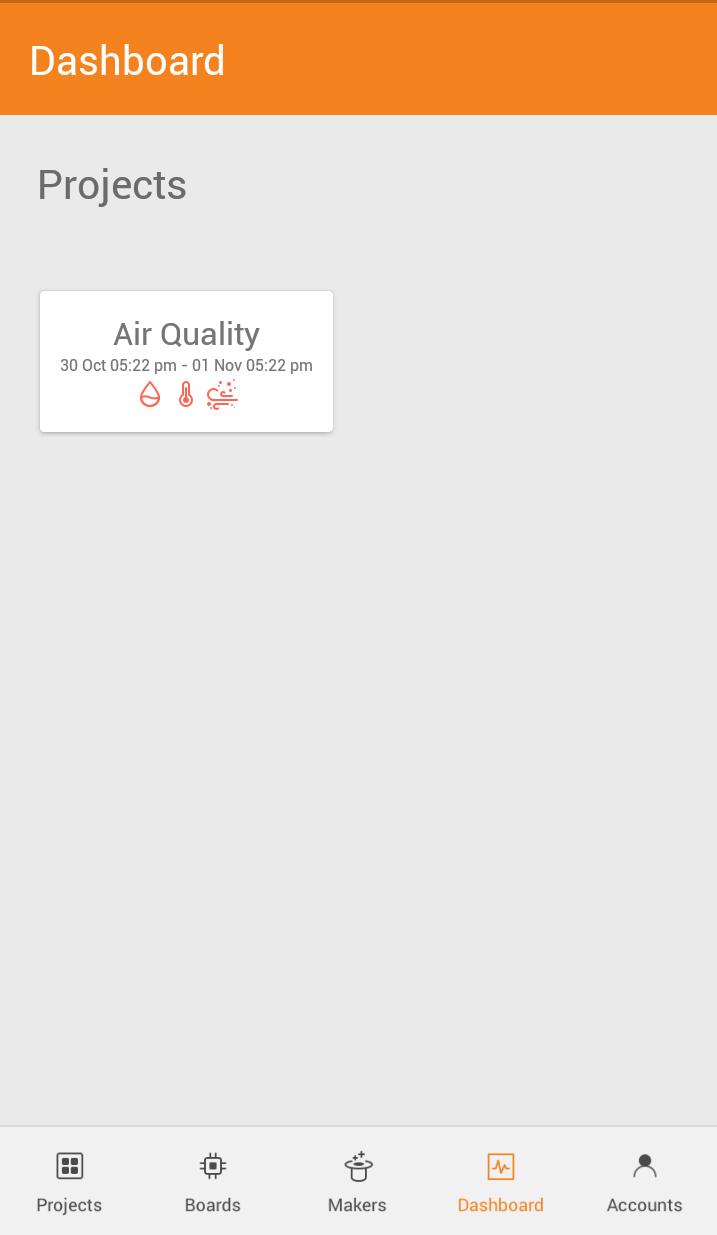
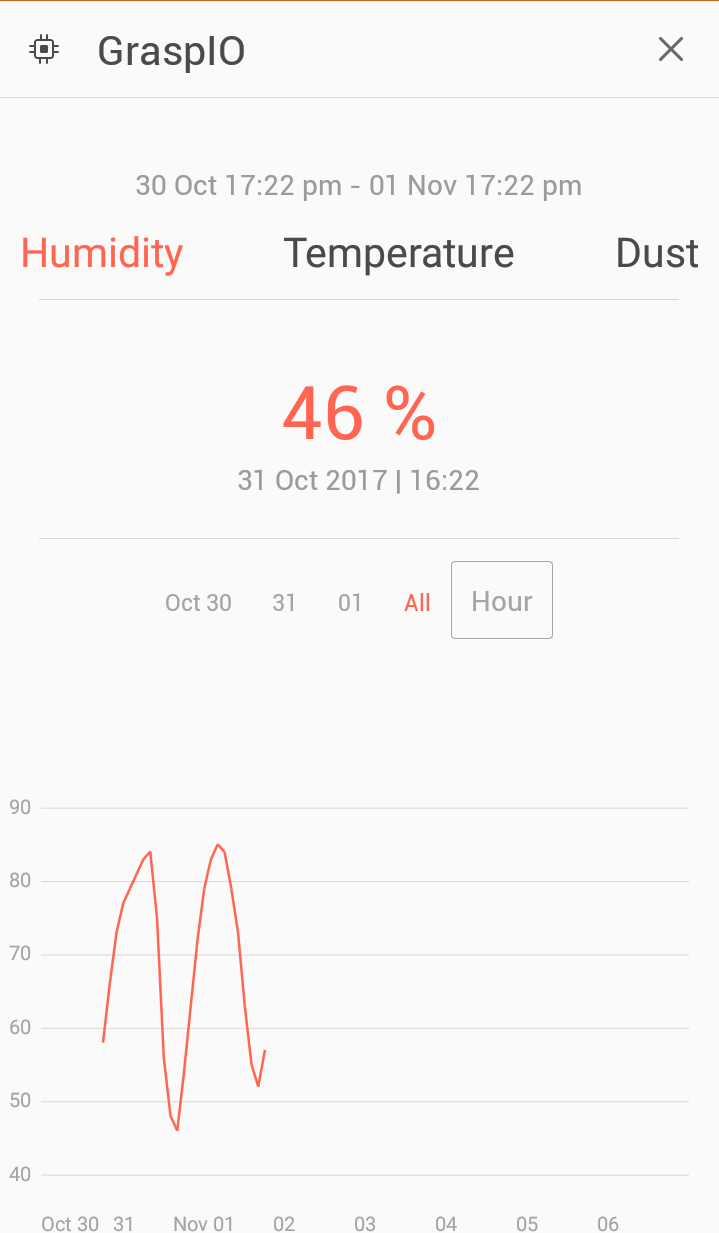
You can view the graphical data for the monitoring duration thus far.
You can also select the different tabs on the graph to display data
By the sensor
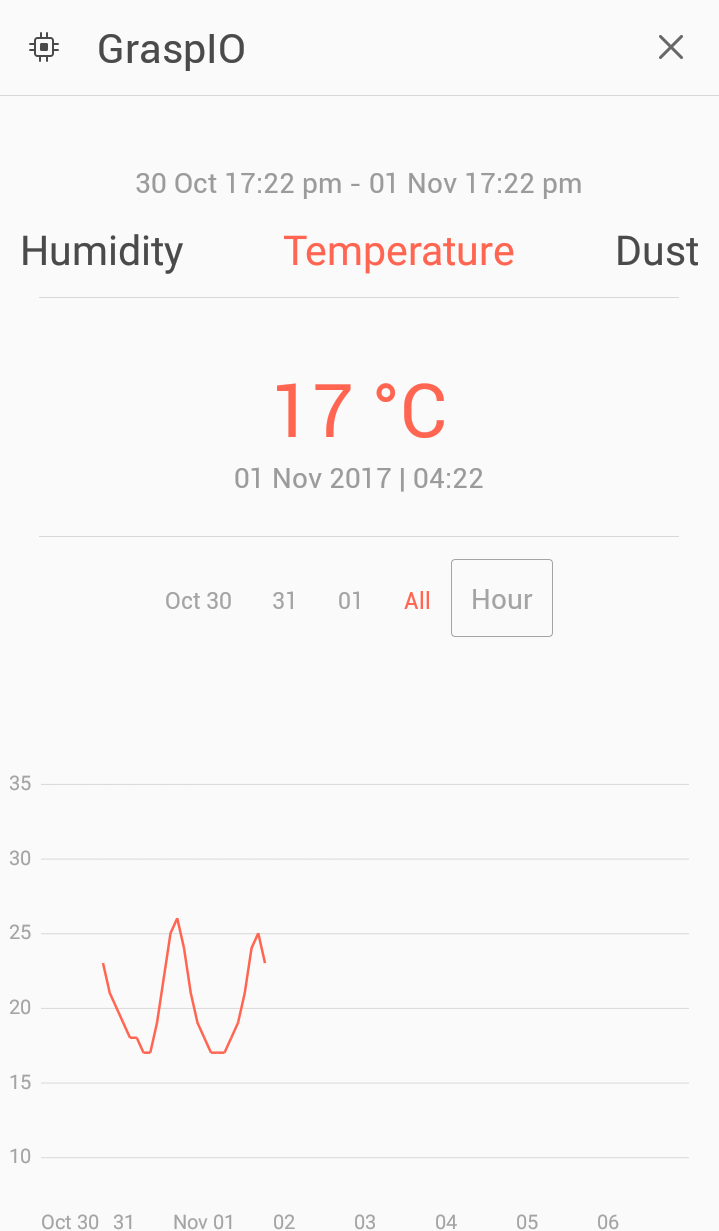
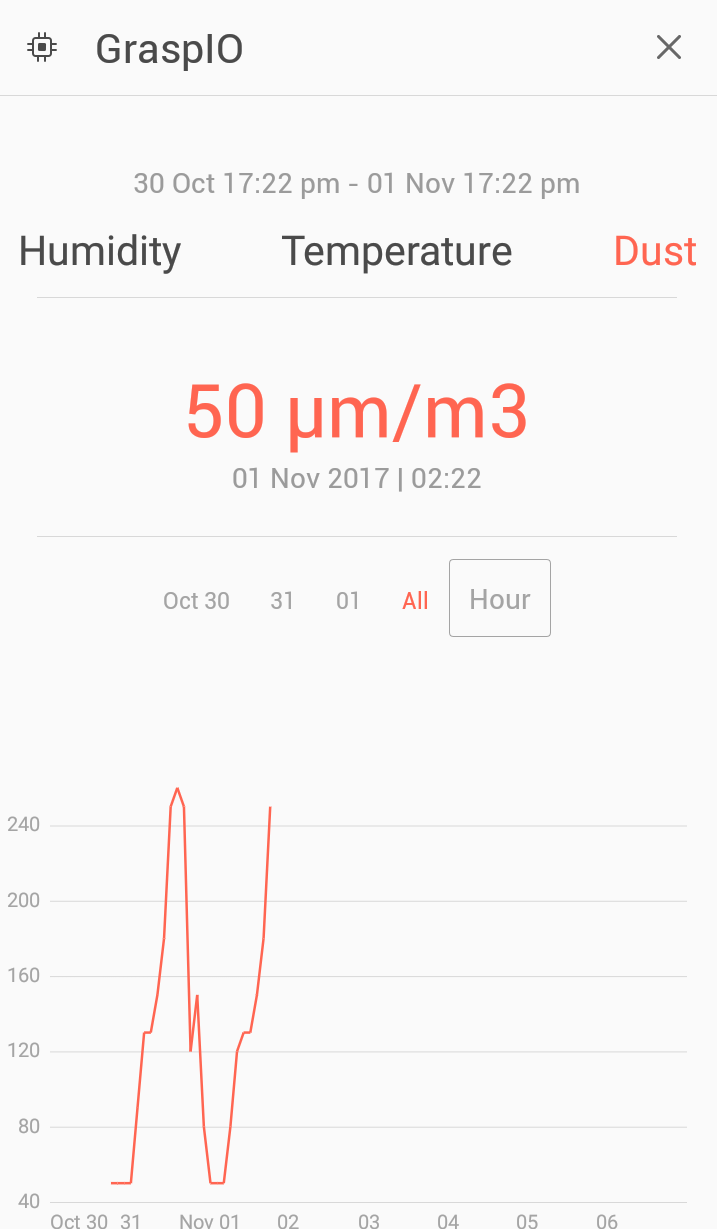
By the day
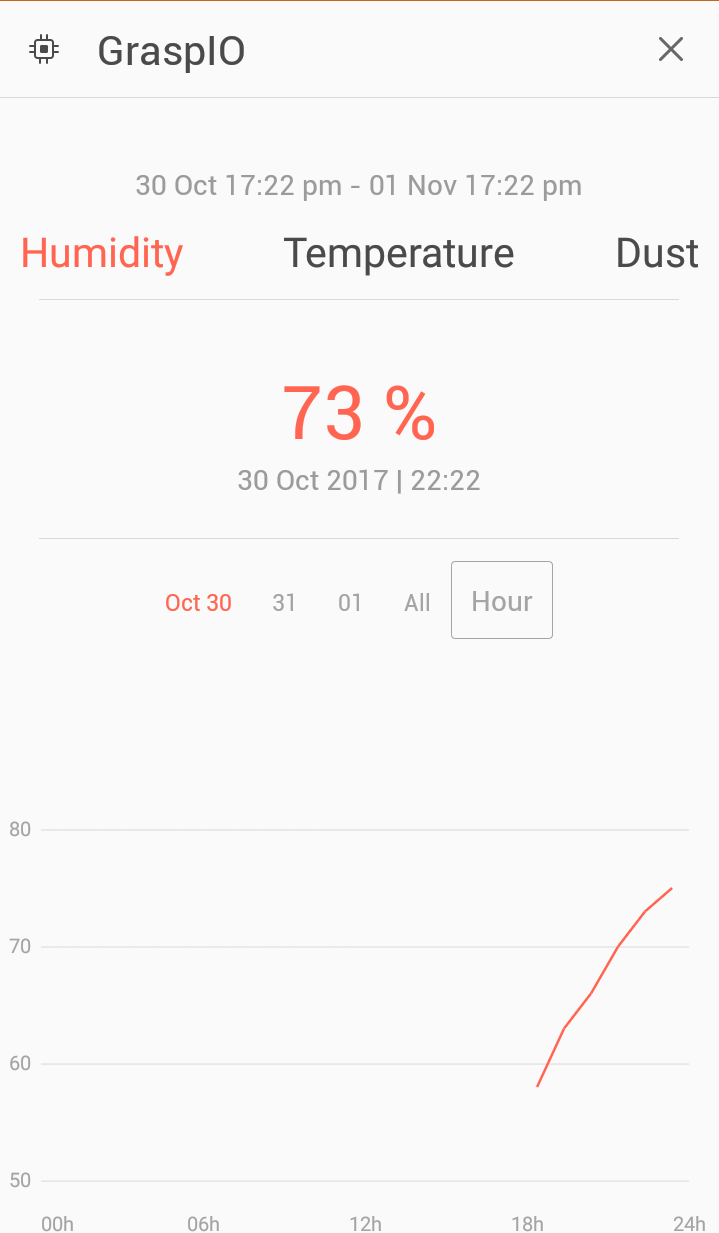
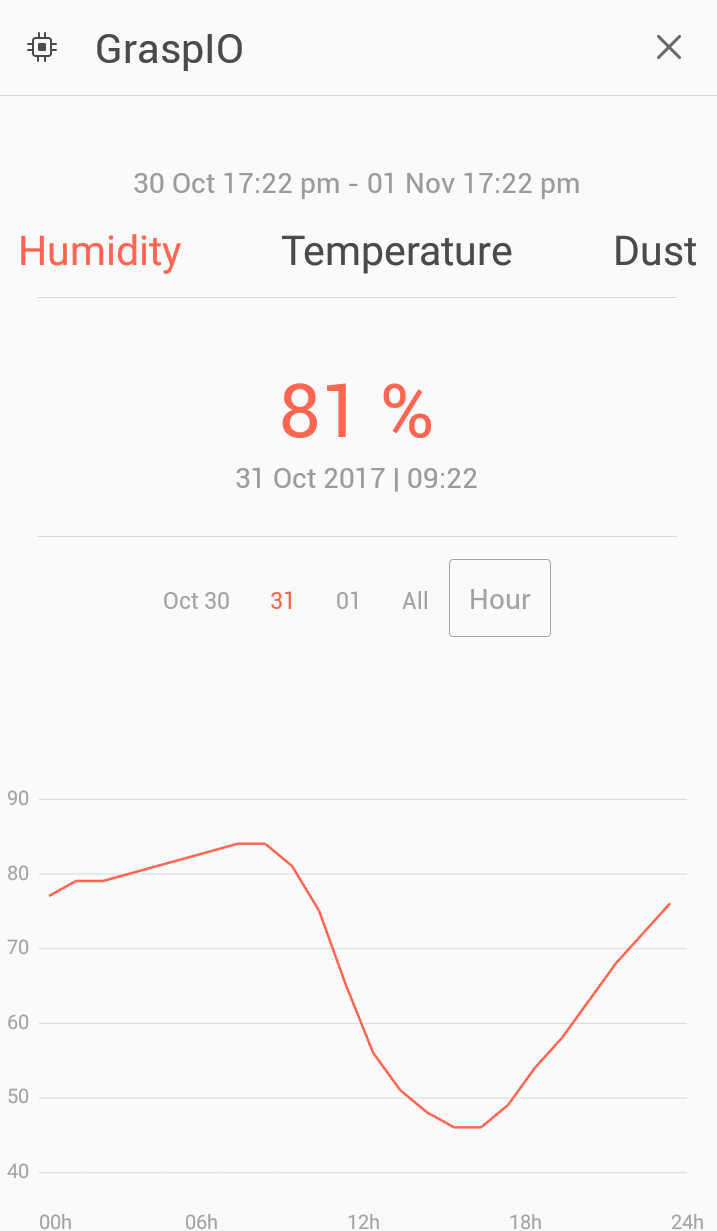
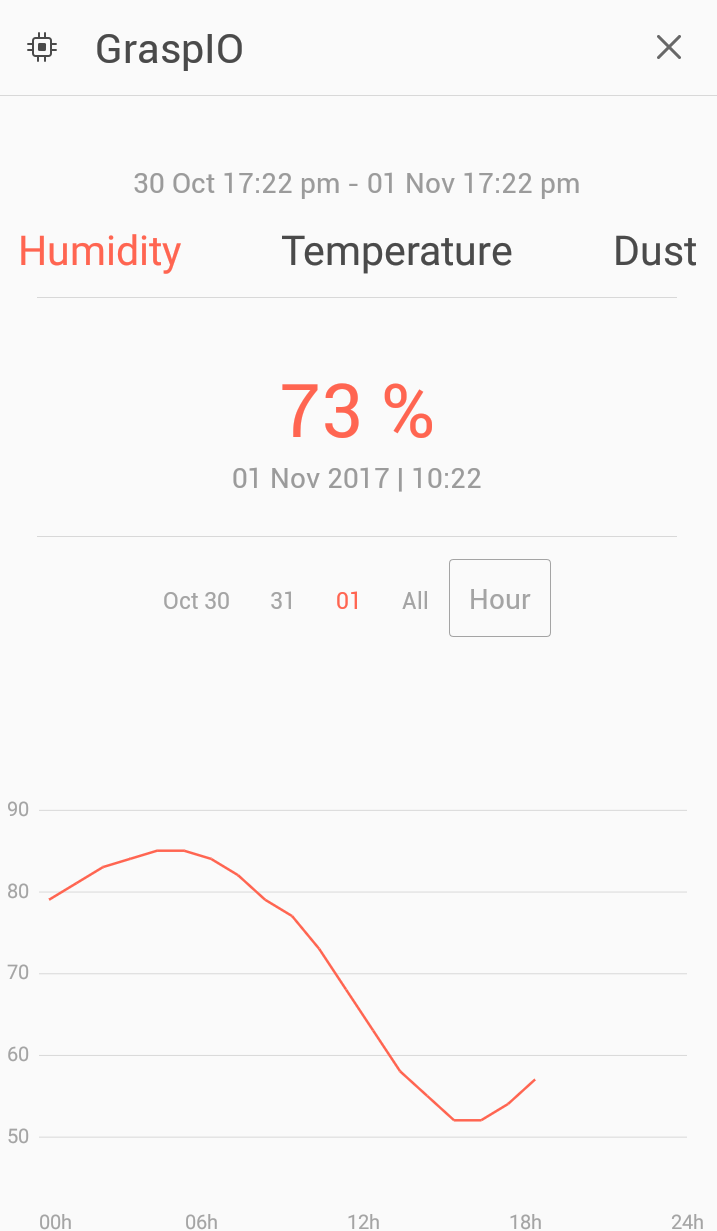
By the hour
You can do this by pressing the Hour button
Guidelines
- A project can contain only 1 Monitor block.
- Input blocks, i.e., sensors, need to be dragged into the Monitor section of the block.
- The blocks included in the Action section run for the same duration as set in the head of the block.
- The action section cannot further contain advanced blocks.
- Selecting a board in the Dashboard section displays the graphical data corresponding to the current (or the latest) project run on it. We recommend that you export and save the data corresponding to it before you upload another project to the board.
Examples
-
The below project monitors and collects data from the Humidity, Temperature, and Dust sensor for 2 days.
(Note: The ports are selected when the input block is dragged inside the Monitor block)
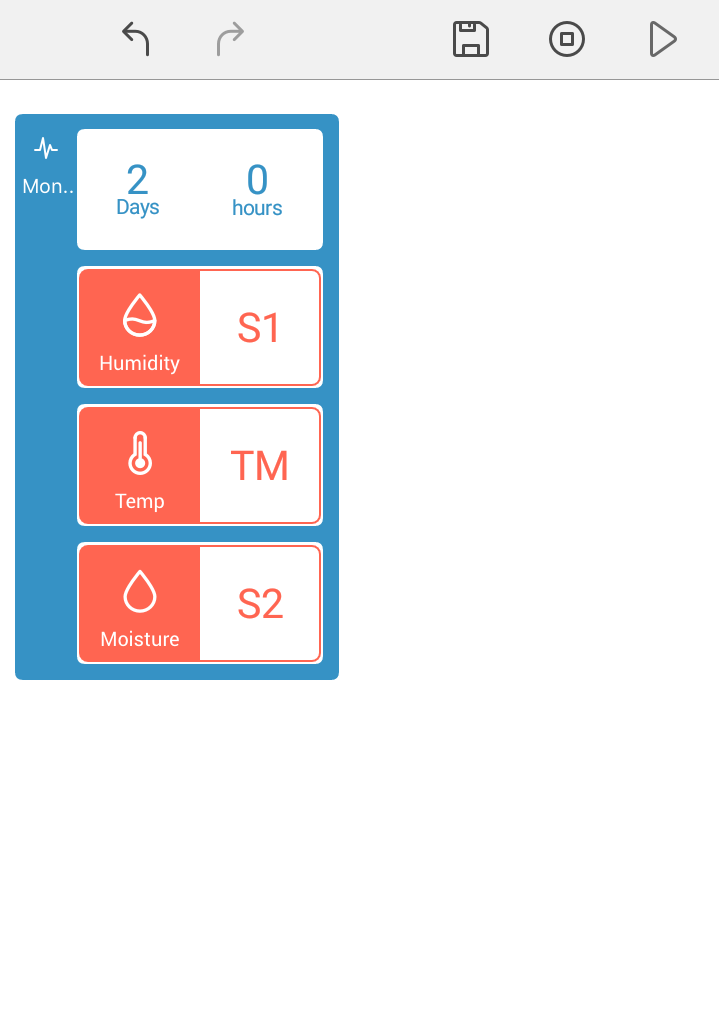
The data thus collected is displayed in the Dashboard section of the app.

You can select the various tabs to view the data by the sensor, date, or by the hour. -
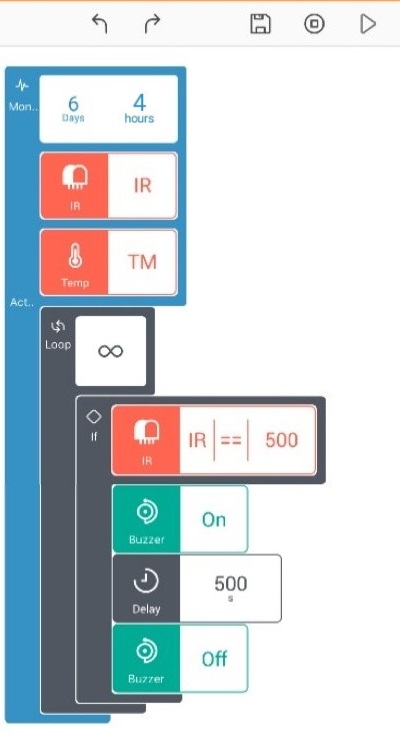
The below project monitors and collects data from the IR sensor and Temperature sensor for 6 days and 4 hours.
Additionally, for this duration, the IR sensor’s value is checked continuously, and the buzzer is turned on for 500 seconds when the sensor value equals 500.
